Manhattan Market Report for the week ending April 7, 2023, Supply closed out at 6,721. Pending Sales at 2,803 and off-market listings (delisting) maintain the market pulse at a .42% level. The market’s liquidity may be plateauing. Consumer prices rose 5 percent in the year through March, a sharp slowdown from recent months. But there were still some troubling signs in the report, complicating the Federal Reserve’s plans for interest rates. The Fed will most likely continue to raise rates in smaller increments.
Surprisingly to many. The U.S. homeownership rate is ABOVE the long-term average and at the second-highest rate on record outside of the late ’90s through the mid-2000s leading up to the housing bubble and the Great Financial Crisis. (Excluding the Q2 2020 blip when the Census had data tracking issues due to COVID.)
“Since the first Manhattan condo was launched in 1965, nearly 3,000 condos have been developed with 115,000 units. Before condos, though, Manhattan was filled up with co-ops. You might expect that condo sales would have overtaken co-op sales by now. However, this hasn’t happened. The answer may surprise you. In the chart below, each bar shows one month’s sales. The sales for each property type are stacked on top of the other so that the bar represents 100% of sales.

Blue Bars
Red Bar
Yellow Bar
Green Bar
Sales by Price
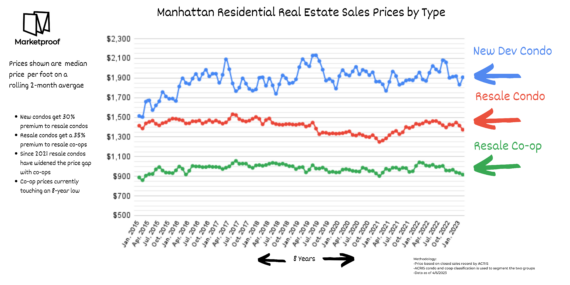
When you add it all up, though developers don’t build many co-ops these days, they also don’t build enough condos to overtake the number of co-ops. The result is that co-ops have maintained market share but at lower prices than resale condos and much lower prices than new development condos.” – Market Proof
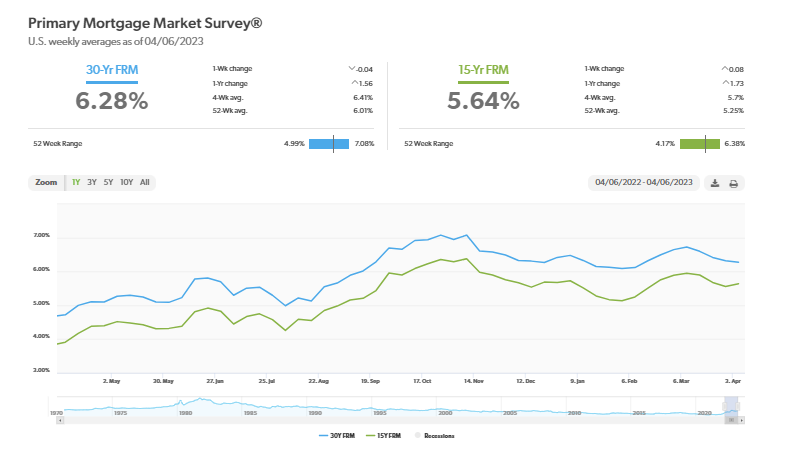
Mortgage Rates
Mortgage rates continue to trend down entering the traditional spring homebuying season. Unfortunately, those in the market to buy are facing several challenges, not the least of which is the low inventory of homes for sale, especially for aspiring first-time homebuyers. – Freddie Mac April 6, 2023
The Report
Additionally, “With affluent individuals from overseas stepping back into the game to purchase their dream property, the Coldwell Banker Global Luxury program fielded a new survey to explore the trends and attitudes of the wealthy international consumer. Polling more than 1,200 high-net-worth consumers from 12 countries on their dreams and sentiments of buying U.S. real estate, paired with our annual luxury real estate outlook.”
Furthermore, “The number of global millionaires is at its highest point in history. By 2026, it is estimated that the number of millionaires worldwide will surge by 40%, and one in seven adults will have a net worth of at least $1 million”; “The Report.”
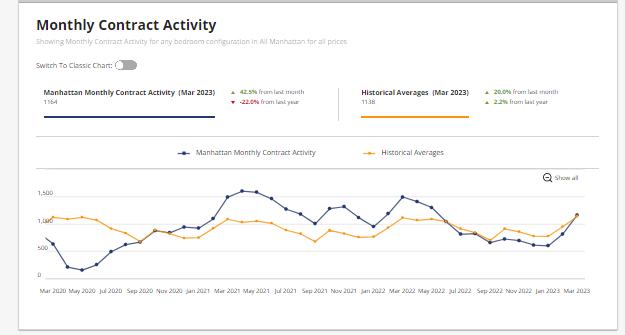
Monthly Contract Activity
Monthly Contract Activity resides at 1164 (blue bar). The blue bar has merged with the historical average of 1138 (gold bar) and is in a range-bound market path. Contracts Signed activity has picked up and is visible in the graph below, showing the blue bar spiking upward since January.
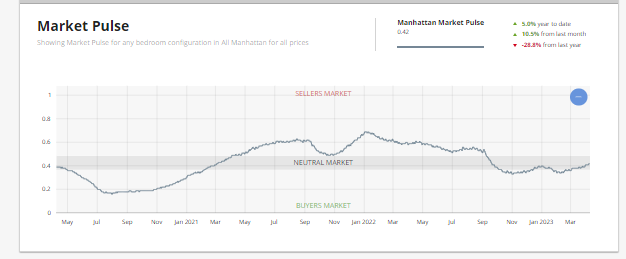
Market Pulse
The market pulse measures the ratio of supply and demand seems to continue to evidence the beginning of the buy-side leverage peaking. The market pulse is residing in Neutral Territory – .4%. In the UrbanDigs Market Pulse, the Manhattan Pending Sales to Supply ratio is .42% (Leverage is going toward the sell side). 2,803 Contacts are waiting to close. In Manhattan, price discovery takes 4-6 months.
The weekly supply is down and resides at “338”. The weekly contract signed for the eighth week is above 200 and resides at “249”. Off Market is higher than recently and stands at 167 listings. We are out of the low liquidity zone and shifting to the neutral zone as we enter the busy spring season. There are micro markets in Manhattan in the Seller Zone. NOTE this is not price volume. This is deal volume showing that sellers are receiving bids.
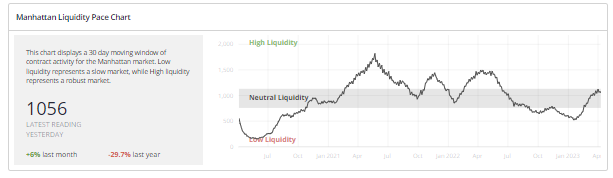
Liquidity Pace
This chart displays a 30-day moving window of contract activity for the Manhattan market. Low liquidity represents a slow market, while High liquidity represents a robust market. Urban Digs Market Pulse has moved up to.42%. The rise in liquidity from the chart below appears to be possibly plateauing.
New Development
“Despite the religious holidays this week, buyers remained active, signing contracts on 74 new development units. Compare that to the weeks of Thanksgiving, Christmas, and New Year – when 35, 39, and 44 contracts were signed – and you’ll understand how strong demand is right now.”
– Kael Goodman, co-founder, and CEO
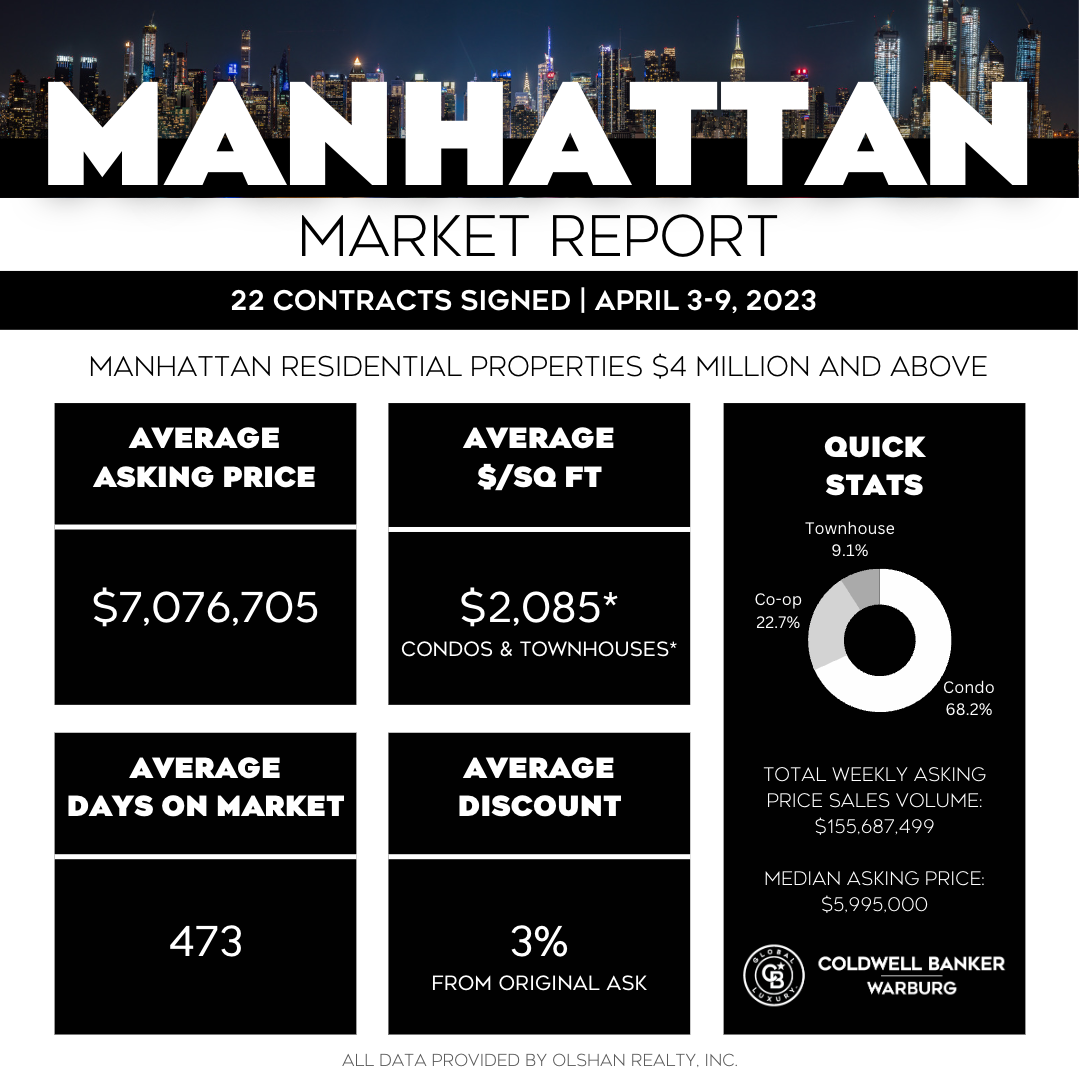
Twenty-two contracts were signed the week of April 3 – 9, 2023, for Manhattan Residential Properties $4 million and above – 12 fewer than the previous week. However, considering Passover into Good Friday into Easter Sunday, it’s also just about average for the holiday week. 15 condos | 5 coops | 2 townhouses. _ Olshan Report
Top 3 Contracts
- 217 West 57th Street -92W (62nd Floor) | Asking Price is $19.054 million
- 50 West 66th Street, Unit 15D | Asking 11.875 million
- 111 Jane Street PH | Asking $9,995,000
Total Weekly Asking Price Sales Volume: $155,687,499 | Average Asking Price: $7,076,705 | Median Asking Price: $5,995,000 | Average Discount from Original Ask to Last Asking Price: 3% | Average Days on Market: 473
74 sponsor deals were reported city-wide, reflecting $259 Million.
Sponsor sales significantly more than those signed during the most recent three holiday weeks of Thanksgiving (35), Christmas (39), and New Year (44), and significantly more, too, than the pre-pandemic benchmark of 53. Week-over-week, total dollar volume was down to $152M (–16%), the average price was up slightly to $2.05M, and the average PPSF increased to $1,758 (+9%).
Closed sales notched their highest weekly tally YTD, $259M, thanks to 114 deals, including one at Central Park Tower for $44.6M.
The $4M+ luxury sector softened this week, posting only 5 contracts, three less than the week before and the pre-pandemic benchmark of 8.
Of the 74 contracts signed this week, 35 (–15%) were in Manhattan, 25 (–32%) were in Brooklyn, and 14 (+17%) were in Queens. – Market Proof