Manhattan Market Report for the week ending April 14, 2023, Supply closed out at 6,939. Pending Sales at 2,828 and off-market listings (delisting) maintain the market pulse at a .41% level.
Surprisingly to many. The U.S. homeownership rate is ABOVE the long-term average and at the second-highest rate on record outside of the late ’90s through the mid-2000s leading up to the housing bubble and the Great Financial Crisis. (Excluding the Q2 2020 blip when the Census had data tracking issues due to COVID.)
Manhattan Real Estate by Property Type
“Since the first Manhattan condo was launched in 1965, nearly 3,000 condos have been developed with 115,000 units. Before condos, though, Manhattan was filled up with co-ops. You might expect that condo sales would have overtaken co-op sales by now. However, this hasn’t happened. The answer may surprise you. In the chart below, each bar shows one month’s sales. The sales for each property type are stacked on top of the other so that the bar represents 100% of sales.

Blue Bars
Red Bar
Yellow Bar
Green Bar
Sales by Price
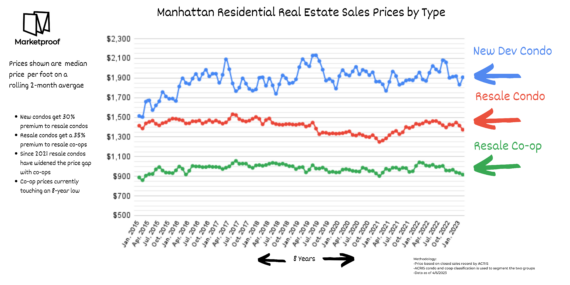
When you add it all up, though developers don’t build many co-ops these days, they also don’t build enough condos to overtake the number of co-ops. The result is that co-ops have maintained market share but at lower prices than resale condos and much lower prices than new development condos.” – Market Proof.
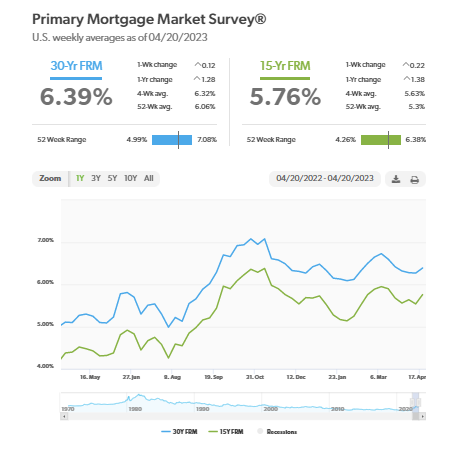
Mortgage Rates
Mortgage rates increased for the first time in over a month due to shifting market expectations. Home prices have stabilized somewhat, but with supply tight and rates stuck above six percent, affordable housing continues to be a serious issue for potential homebuyers. Demand will only modestly recover if rates drop into the mid-five percent range.– Freddie Mac April 20, 2023
The Report
Additionally, “With affluent individuals from overseas stepping back into the game to purchase their dream property, the Coldwell Banker Global Luxury program fielded a new survey to explore the trends and attitudes of the wealthy international consumer. Polling more than 1,200 high-net-worth consumers from 12 countries on their dreams and sentiments of buying U.S. real estate, paired with our annual luxury real estate outlook.”
Furthermore, “The number of global millionaires is at its highest point in history. By 2026, it is estimated that the number of millionaires worldwide will surge by 40%, and one in seven adults will have a net worth of at least $1 million”; “The Report.”
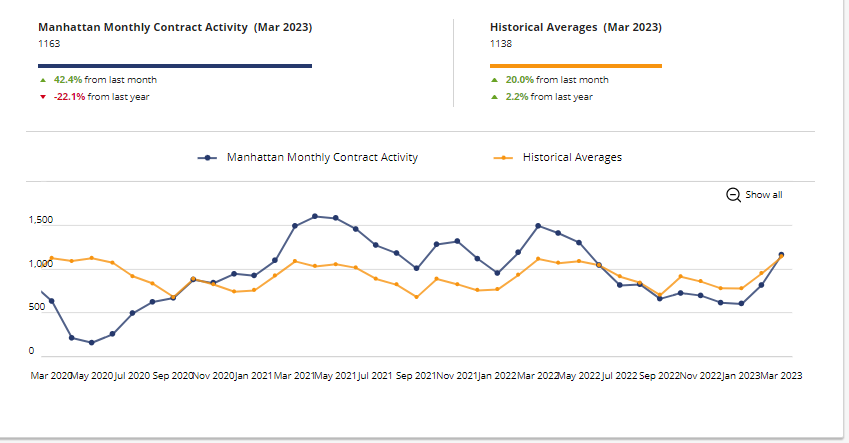
Monthly Contract Activity
Monthly Contract Activity resides at 1164 (blue bar). The blue bar has merged with the historical average of 1138 (gold bar) and is in a range-bound market path. The Monthly Contract Activity (blue bar) is converging with the Historial Averages (yellow bar).
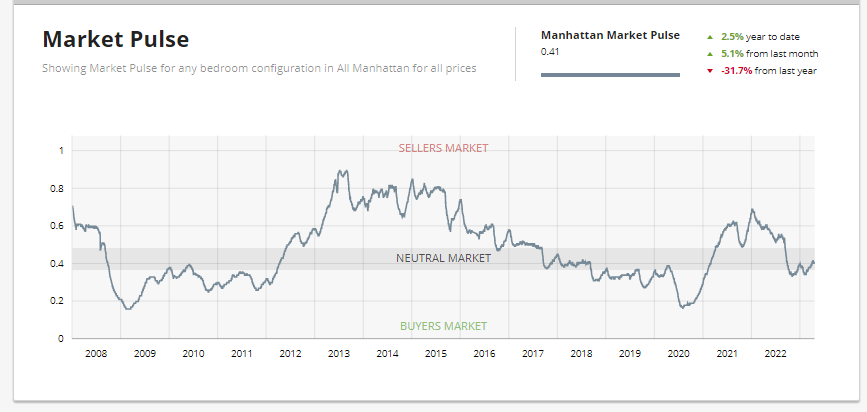
Market Pulse
The market pulse measures the ratio of supply and demand seems to continue to evidence the beginning of the buy-side leverage peaking. The market pulse is residing in Neutral Territory – .4%. In the UrbanDigs Market Pulse, the Manhattan Pending Sales to Supply ratio is .41% (Leverage is going toward the sell side). 2,803 Contacts are waiting to close. In Manhattan, price discovery takes 4-6 months.
The weekly supply is bumped up considerably and resides at “429”. The weekly contract signed dropped due to a holiday week and resided at “141”. Off Market is higher than recently and stands at 107 listings. The drop in weekly contracts signed, especially if prolonged, could weaken the market pulse, which is barely in the neutral zone, resulting in a compressed active season.
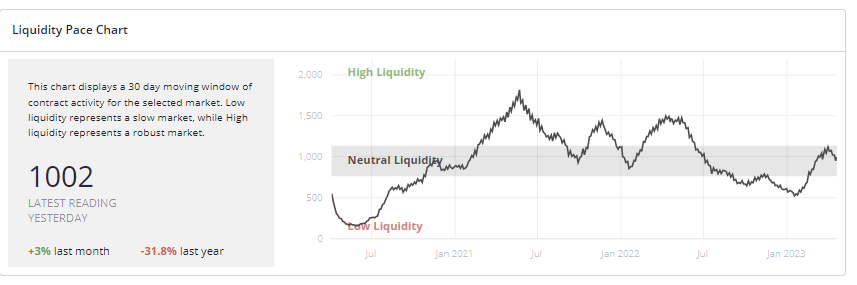
Liquidity Pace
This chart displays a 30-day moving window of contract activity for the Manhattan market. Low liquidity represents a slow market, while High liquidity represents a robust market. Urban Digs Market Pulse has moved up to.41%. The wobble in the pace of liquidity suggests Manhattan may have seen its highs this season.
New Development
Excluding the ‘catch-up’ reporting of signed contracts by The Greene, NYC came dangerously close to snapping its 12-week winning streak*. We believe, however, that this week’s relatively anemic contract volume is not a changing tide but rather a temporary carryover of buyer distraction from last week’s religious and academic holidays and that we’ll see a quick return to solid demand.”
– Kael Goodman, co-founder, and CEO
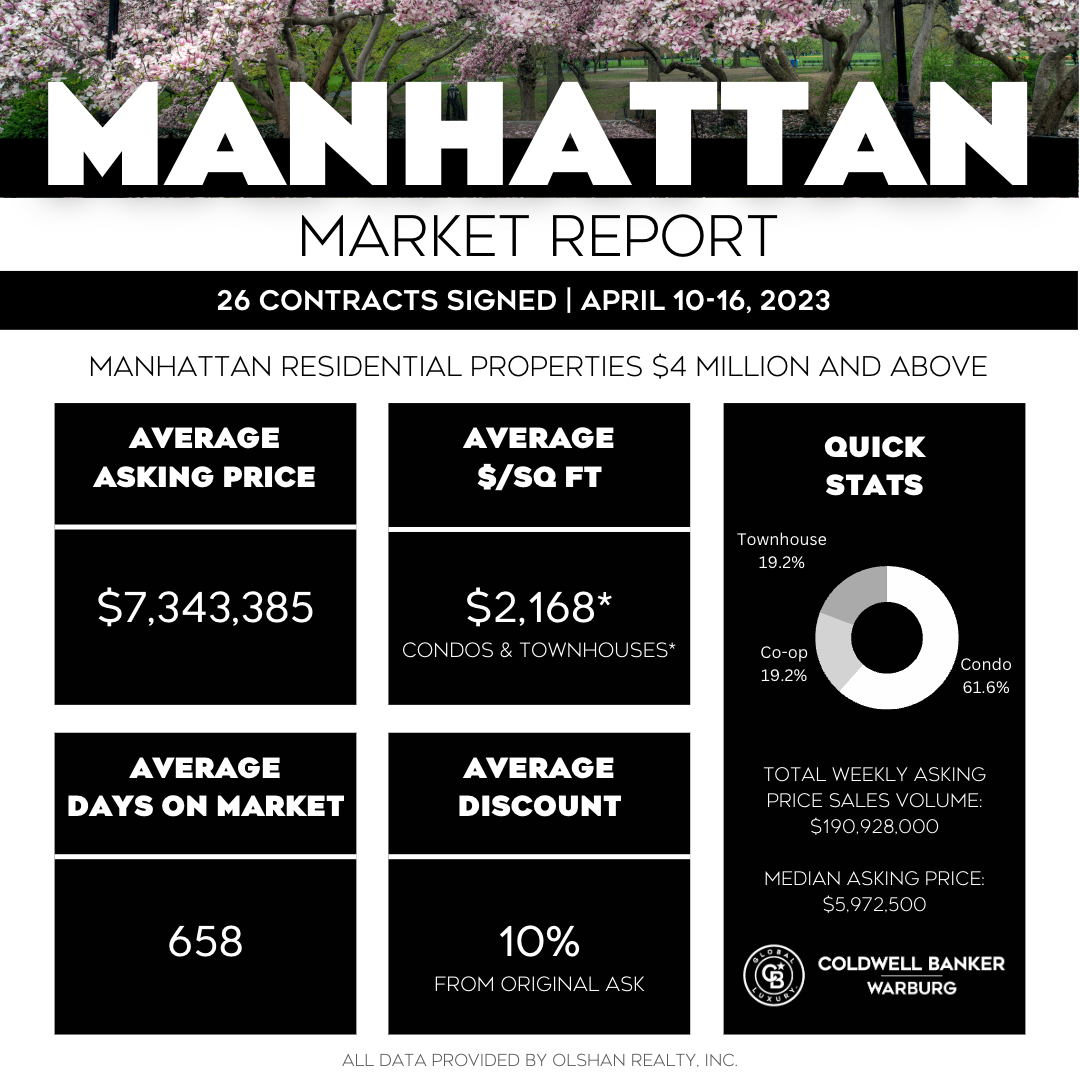
Twenty-six “26” contracts, four more than the previous “holiday” week (Week of April 10-16), for $4 million and over. Condos 16 | Coops 5 | Townhouses 5. Two duplex condos scored the top 2 slots.
The usual condos-outselling-coops continues, with the two top sales in new developments/conversions.
Top 3 Contracts
- Steinway Building: 111 West 57th Street Unit 17S (Averaging $5,254/sqft) | Asking: $15.75 million
- Belnord: 225 West 86th Street Unit 1112 | Asking $13,195 million
- 11 East 76th Street | Townhouse | Asking $12,500 million
Total Weekly Asking Price Sales Volume: $190,928,000 | Average Asking Price: $7,343,385 | Median Asking Price: $5,972,500 | Average Discount from Original Ask to Last Asking Price: 10% | Average Days on Market: 698.
Urban Digs Market Pulse (measuring supply and demand) resides at .41%. Due to a holiday week, there was a significant boost of much need inventory to enter the market. Supply currently resides at 547, and Contract Signed is playing catch up and is getting ready to break the 200 markets. One hundred twenty-five listings are coming off the market for a make-up refresh or a seller’s decision to rent. Rentals under $10,000 are in high demand.
NYC Narrowly Extends its Contract Streak to 12 Weeks
“The 88 sponsor contracts reported this week are deceiving because roughly three dozen represent “catch-up” reporting at Long Island City’s The Greene. Excluding those, NYC narrowly missed breaking its winning streak – now at 12 weeks – of contract volume above its pre-pandemic benchmark. With Queens dominating contract volume this week, average price and average PPSF were both down to $1.76M (–14%) and $1,599 (–9%), but a large number of previously unreported contracts moved total dollar volume higher from $152M to $155M.
This week, the $4M+ luxury sector underperformed again with five contracts compared to its pre-pandemic benchmark of 8.
Of the 88 contracts signed this week, 22 (–37%) were in Manhattan, 23 (–8%) were in Brooklyn, and 43 (+207%) were in Queens.” – Market Proof.
Manhattan Reports 22 Contracts Totaling $86M
Although the average price increased 36% week-over-week to $3.9M, total dollar volume slid from $100M to $86M because only 22 (–37%) contracts were signed. The average PPSF was stable at $2,207.