“The best investment on earth is earth.” – Louis Glickman
Mortgage Rates
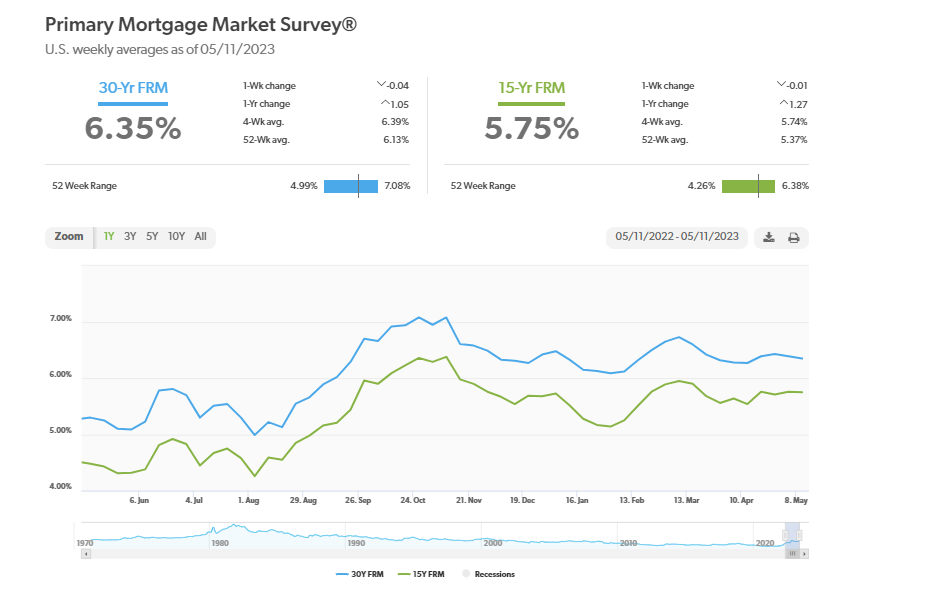
The 30-year fixed-rate mortgage averaged 6.39 percent this week, as economic crosscurrents have kept rates within a ten-basis point range over the last several weeks. After the substantial slowdown in growth last fall, home prices stabilized during the winter and began to rise modestly over the previous few months. This indicates that while affordability remains a hurdle, homebuyers are getting used to current rates and continue to pursue homeownership. – Freddie Mac
The Report
Additionally, “With affluent individuals from overseas stepping back into the game to purchase their dream property, the Coldwell Banker Global Luxury program fielded a new survey to explore the trends and attitudes of the wealthy international consumer. Polling more than 1,200 high-net-worth consumers from 12 countries on their dreams and sentiments of buying U.S. real estate, paired with our annual luxury real estate outlook.”
Furthermore, “The number of global millionaires is at its highest point in history. By 2026, it is estimated that the number of millionaires worldwide will surge by 40%, and one in seven adults will have a net worth of at least $1 million”; “The Report.”
Monthly Contract Activity
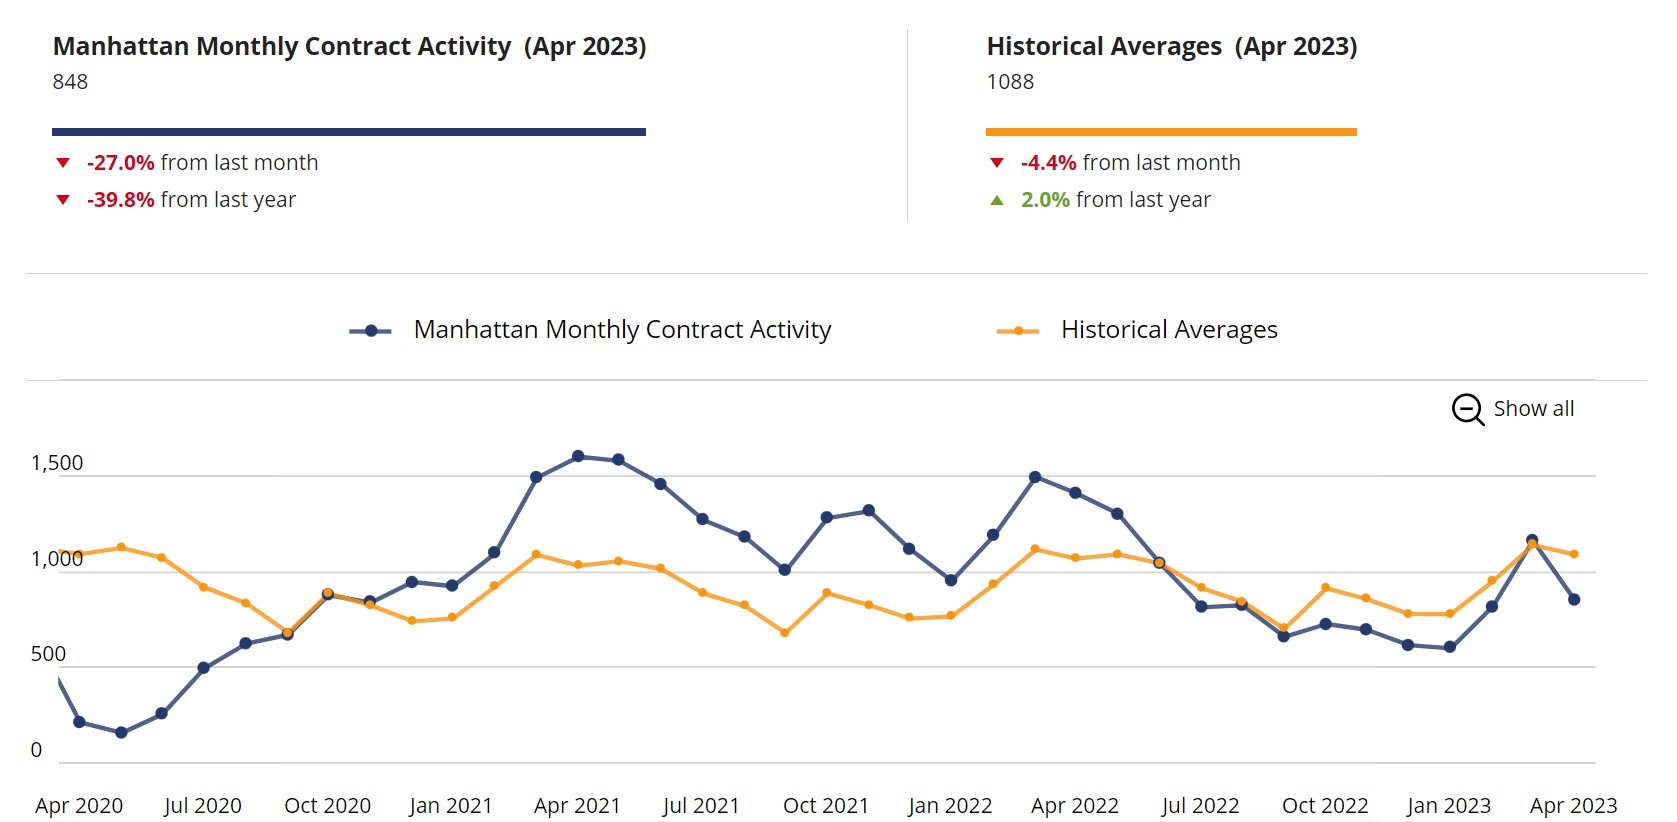
Monthly Contract Activity resides at 848 (blue bar). The blue bar has merged with the historical average of 1088 (gold bar) and is in a range-bound market path. The Monthly Contract Activity (blue bar) is below the Historial Averages (yellow bar).
Market Pulse
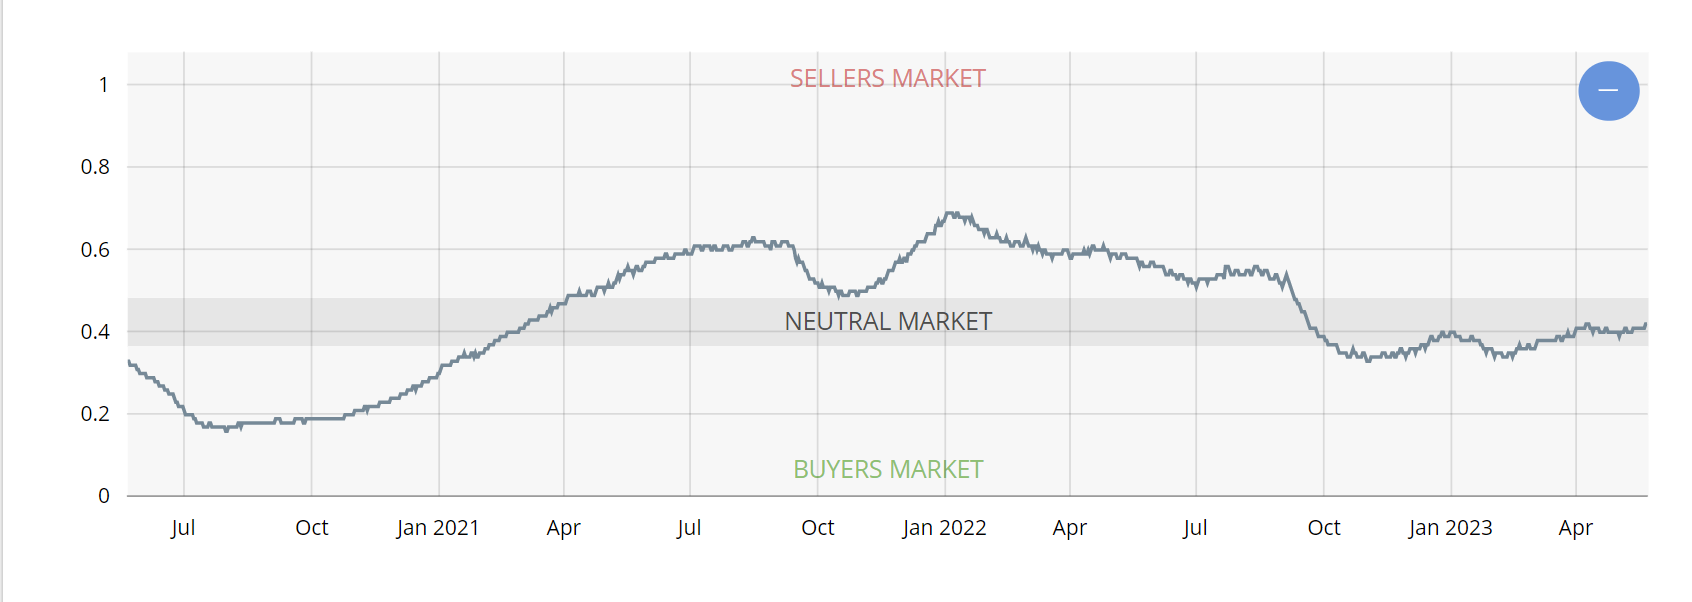
The market pulse measures the ratio of Supply and demand seems to continue to evidence the beginning of the buy-side leverage peaking. The market pulse is residing in Neutral Territory – .4%. In the UrbanDigs Market Pulse, the Manhattan Pending Sales to Supply ratio is .41% (Leverage is going toward the sell side). 2,803 Contacts are waiting to close. In Manhattan, price discovery takes 4-6 months.
The weekly Supply is residing at “434”. The weekly contract signed resides at “253”. Off Market is higher than recently and stands at 130 listings. The drop in weekly contracts signed, significantly if prolonged, could weaken the market pulse, which is barely in the neutral zone, resulting in a compressed active season.
Liquidity Pace
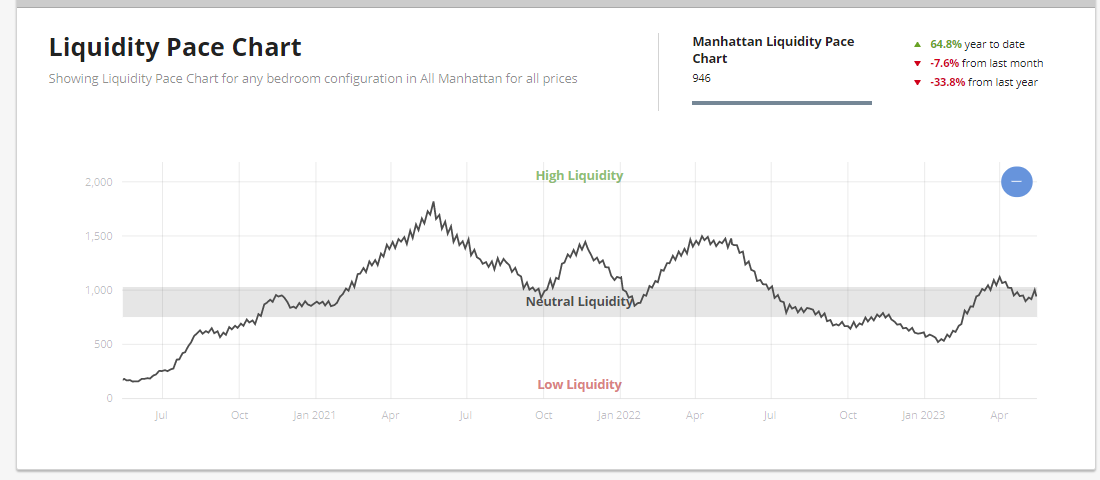
This chart displays a 30-day moving window of contract activity for the Manhattan market. Low liquidity represents a slow market, while High liquidity represents a robust market. Urban Digs Market Pulse has moved up to .42%. The wobble in the pace of liquidity suggests Manhattan may have seen its highs this season.
New Development
“Despite the price and volume metrics being down week-over-week, the demand for new development has been consistently above the pre-pandemic 2015-2019 average* for the past 17 weeks. This week, 71 contracts were signed versus the historical average of 53.”
– Kael Goodman, co-founder and CEO
Manhattan Luxury Market
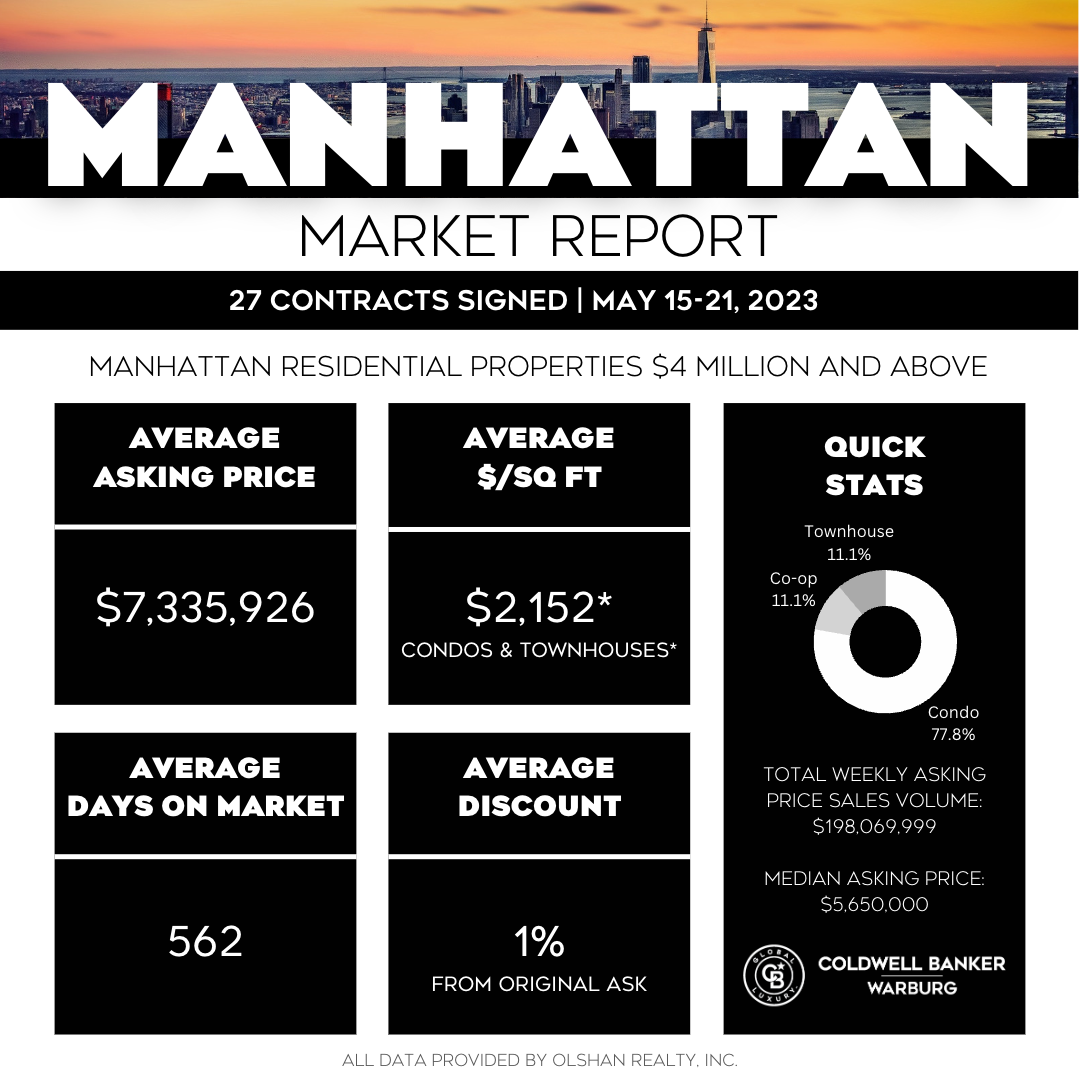
Twenty-seven (“27”) contracts were signed for listings asking over $4 million, down from the previous week’s 40 contracts for the week of May 15 through 21st. Twenty-one (“21”) condos went into contract instead of three coops and three townhouses.
For the second week in a row, Coldwell Banker Warburg made the “top ten” – the No. 9 signed contract (and one of just three coops) was Wendy Greenbaum’s listing at 270 West End Avenue (8N), asking $5,995,000.
Condos – 21 | Coops – 3 | and Townhouses – 3
Total Weekly Asking Price Sales Volume $198,069,999| Average Asking Price $7,335,926 | Median Asking Price: $5,650,000 | Average Discount from Original Ask to last Asking Price: 2% | Average Days on Market: 562
Top 3 Contracts
- 60 Collister Street (Tribeca), Unit PH | Asking $26.95 million
- 360 Central Park West, PHD | Asking $14.795 million
- 6 Bank Street (Townhouse) | Asking $12,550 million
UrbanDigs Market Pulses needle moved towards sellers and resided at .42%. Weekly Supply is 434, Under Contract is 253, and Off Market is 130
17 Consecutive Weeks of Above Average Demand
“Despite a week-over-week decline across all metrics, NYC’s new development market added another week to its streak of above-average demand, now at 17. Contract volume slipped from 80 to 71, total dollar volume fell 34% to $172M, and average price and average PPSF dropped to $2.4M (–25%) and $1,945 (–6%), respectively.
With ten contracts, the $4M+ luxury sector was down from last week yet still above its pre-pandemic average of 8.
Of the 71 contracts signed this week, 37 (–29%) were in Manhattan, 29 (+16%) were in Brooklyn, and 5 (+67%) were in Queens.” – Market Proof.
Manhattan Reports 37 Contracts Totaling $132M
“Last week, many of Manhattan’s metrics were at the highest point in more than a year. So, it’s neither surprising nor alarming that the numbers, with the exception of average PPSF, which held steady at $2,417, are down this week. Contract volume and total dollar volume fell to 37 (–29%) and $132M (–39%), respectively, and the average price slid 15% to $3.56M.” – Market Proof.