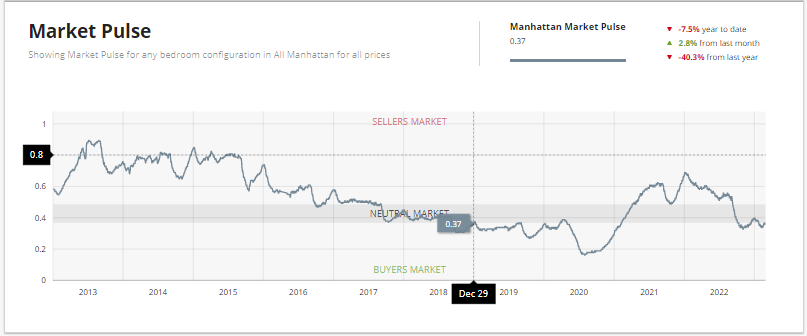
Manhattan Market Report for the week ending February 24th, Supply closed out at 6,173 and trending up 2%. Pending Sales at 2,240 and off-market listings (delisting) maintain the market pulse at a .36% level. Demand is ticking higher. Two consecutive upticks in “demand,” and hopefully, it will remain for the spring season. This was a short holiday week. We are on trend as we move into the busy spring real estate season.
The New York Comptroller, Brand Lander, reports that employment grew and inflation moderated slightly in New York City. As we slowly begin to discover what New York City’s new normal will look like, after the pandemic, office occupant and commuting numbers have remained steady these past few months. He also indicated that public infrastructure spending is a valuable economic activity that can provide a counter-cyclical boost to potential economic woes that may be on the horizon.
Additionally, he indicates the “City’s debt burden is at its lowest level in the past 20 years. After reaching a high of 17.2% in FY 2002, the City’s debt service as a percent of local tax revenues has dropped to 9.7% in FY 2022.
Some of that is because of the low-interest rates of the past decade, and some because tax revenues and property values have grown faster than our capital expenditures. But unfortunately, some of it is because we aren’t very good at executing those capital projects.”
Mortgage Rates Trend Upward
Freddie Mac’s Primary Mortgage Market Survey® (PMMS®), as of February 23rd, shows the 30-year fixed-rate mortgage (FRM) averaged 6.50 percent.
“The economy continues to show strength, and interest rates are repricing to account for the stronger than expected growth, tight labor market, and the threat of sticky inflation,” said Sam Khater, Freddie Mac’s Chief Economist. “Our research shows that rate dispersion increases as mortgage rates trend up. Homebuyers can save $600 to $1,200 annually by shopping among lenders to find a better rate.”
News Facts
- The 30-year fixed-rate mortgage averaged 6.50 percent as of February 23, 2023, up from last week when it averaged 6.32 percent. A year ago at this time, the 30-year FRM averaged 3.89 percent.
- The 15-year fixed-rate mortgage averaged 5.76 percent, up from last week when it averaged 5.51 percent. A year ago at this time, the 15-year FRM averaged 3.14 percent.
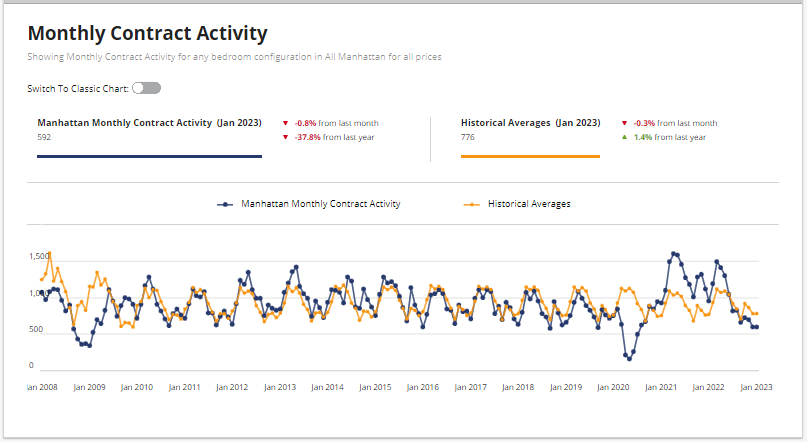
Monthly Contract Activity
Monthly Contract Activity resides at 592 (blue bar), is below the historical average of 776 (gold bar), and is in a range-bound market path. This path is classified as horizontal, ranging, or sideways bound between a high and low range. The monthly Contract Activity range depends on “rate volatility, the Fed, risk assets, credit spread, and other macro indicators.”
Market Pulse
The market pulse measures the ratio of supply and demand seems to continue to evidence the beginning of the buy-side leverage peaking. Continue looking for a “hockey stick” formation before the curve heads upward. The weekly supply is puttering upward and resides at “309”. The weekly contract signed is hovering at “199”. Off Market is lower than recently and stands at 98 listings. It has been a short holiday week, and we are witnessing an upward trend for contracts signed. Looking at the 30-day monthly trend, we currently reside at 858 contracts signed, which is a 78.75% increase. It should be around the 935 level by the end of February. We are out of the low liquidity zone and shifting to the neutral zone as we enter the busy spring season. NOTE this is not price volume. This is deal volume showing that sellers are receiving bids.
New Development
“Despite being a holiday week and the uptick in mortgage rates. Contract volume remained well above its pre-pandemic average* for the 5th straight week. Less expensive units were more popular with buyers this week. Nonetheless, the demand is there.”
– Kael Goodman, co-founder, and CEO
*compared to the average weekly contract volume from 2015-2019, used as a normalized benchmark for comparison as it is the most recent period unaffected by the COVID pandemic.
Top Contract
- The Carhart Mansion – 3 East 94th Street, asking $19.5 million.
Second Contract
- Central Park Tower – 217 West 57th Street 83W on the 53rd Floor (sponsor sale), asking $17,088,000
Third Contract
- 625 Park Avenue, 5A, (JER Carpenter Coop), asking $14,500,000
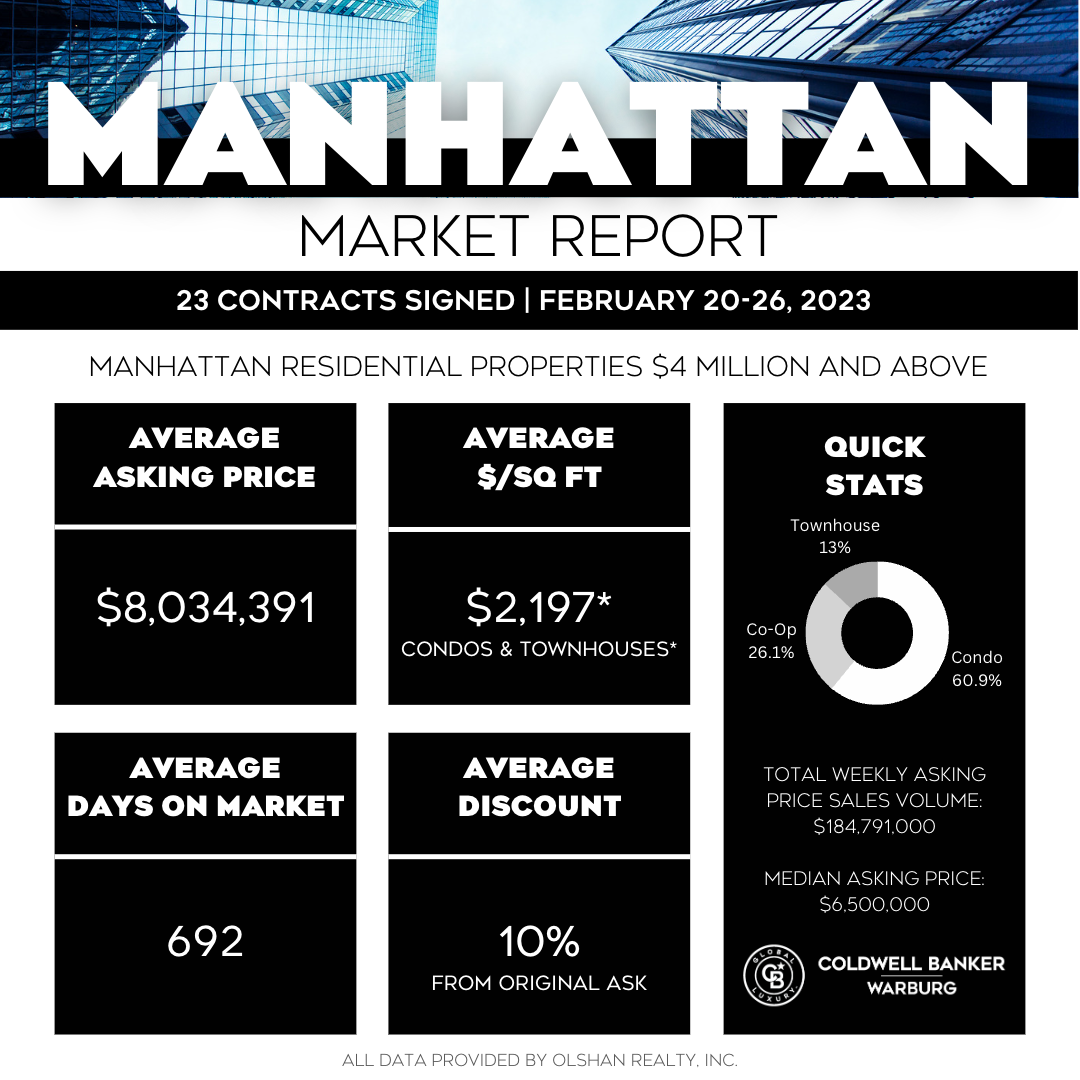
Total Weekly Asking Price Sales Volume: $184,791,000 | Average Asking Price $8,034,391 | Median Asking Price: $6,500,000 | Average Discount from Original Ask to Last Asking Price: 10% | Average Days on Market 692
Condos 69.9%, Coops 26.1%, and Townhouse 13% of current weeks breakdown of sales by property type
Sponsor Activity
Market Proof reports sponsor new development activity from February 20 through 26th. Notably, the “$4M+ luxury market was significantly lower this week after a big showing last week, down from 14 contracts to 4. Nevertheless, we see no cause for concern it was a short holiday week. Additionally, the 2-week average of 9 contracts is still in line with the pre-pandemic weekly average of 8. Furthermore, a strong week followed by a light one is a pattern we have seen numerous times over the past nine months.”
Of the 62 contracts this week, 32 (–3%) were signed in Manhattan, 24 (–25%) were signed in Brooklyn, and 6 (+50%) were recorded in Queens.